Communicate your work with animated graphs in R!

It’s easy to animate graphs in R

In this post am I going to show you how easy it is to animate figures in R thanks to the great ggplot2 extension gganimate written by Thomas Lin Pedersen and David Robinson

This is something you might want to do to increase the impact of your work by communicating it through twitter, a website or live in a presentation.
Imagine you have carried out an experiment to test whether the growth of different Ralstonia solanacearum strains could be inhibited by a treatment X. R.solanacearum is a bacterium which causes many plant diseases so controlling it is beneficial. You measured the growth of each strain of R.solanacearum with and without the potential inhibitor (treatment X vs control) each day for 20 days and you did five replicates of each treatment combination.

Your dataset will have: 5 strains x 2 treatments x 20 days x 5 replicates = 1000 rows. For a report or article you might highlight the difference between the strains in their response to the treatment by plotting the last time point only. Something like this:

deomfig1-1


Or perhaps you’d like to emphasize the effects of treatment and time (and average over the strains) like this:

deomfig2-1


Or try to show time, strain and treatment on one graph:

deomfig3-1


However, if your communication medium allows it, animation is a space-efficient and easily understood way to illustrate your results.

I will assume you have R Studio installed and have at least a little experience with it but I’m aiming to make this do-able for novices.

1. Preparing

The first thing you want to do is make a folder on your computer in where your code and the data for plotting will live. This is your working directory.
Now get a copy of the data by saving this file. The important thing is to save it to your working directory (the folder you just made).

2. Getting started in RStudio

Start R Studio and set your working directory to the folder you created:

Setting your working directory

Now start a new script file:

starting a new script file

and save it as animatedfigure.R or similar.

You will need the devtools package to install gganimate

devtools and gganimate are already installed for biologists at the University of York. If you are on your own computer you will need to install them.

To do this you first install devtools in the normal way. Click the install button and write the package name in the box to install it.

installing packages

R Studio may need to install additional packages. You will also need the Rmisc package for summarizing data so install that too.

You can now use the install_github() function in the devtools package to install gganimate:

# install gganimate from github
devtools::install_github("thomasp85/gganimate")

When everything is finished, you are ready to start coding!

3. Starting to code

Make the packages available for use in this R Studio session by adding this code to your script and running it.

# load the gganimate and Rmisc packages
library(gganimate)
library(Rmisc)

4. Read the data in to R

The data are in a plain text file where the first row gives the column names. It can be read in to a dataframe with the read.table() command:

ralstonia <- read.table("ralstonia.txt", header = TRUE)

5. Summarising the data for plotting

We need the means and standard errors for each group. This requires us to summarize over the replicates which we can do with the summarySE():

ralstoniasum <- summarySE(data = ralstonia, measurevar = "OD",
                 groupvars = c("strain", "treatment","day"))

6. A static figure

We can get a default figure of the last time point only this:

ggplot(data = ralstoniasum[ralstoniasum$day == 19,], aes(x = strain, y = OD, fill = treatment )) +
  geom_bar(stat = "identity",colour = "black", position = position_dodge()) +
  geom_errorbar(aes(ymin = OD - se, ymax = OD + se),
                width = 0.3, position = position_dodge(0.9)) 

staticdefaultfig-1


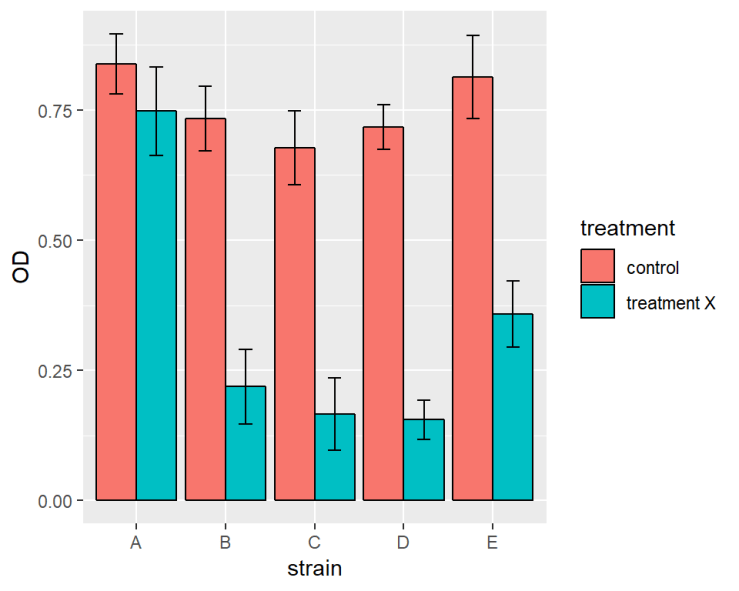
ralstoniasum[ralstoniasum$day == 19,] means only the last time point is plotted rather than the whole of ralstoniasum

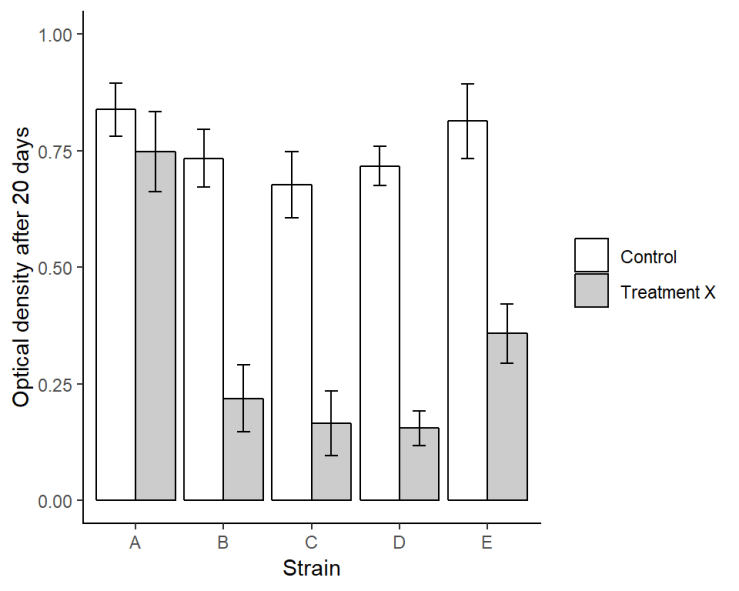
Or we make it a bit more publication friendly with some extra code:

ggplot(data = ralstoniasum[ralstoniasum$day == 19,], aes(x = strain, y = OD, fill = treatment )) +
  geom_bar(stat = "identity",colour = "black", position = position_dodge()) +
  geom_errorbar(aes(ymin = OD - se, ymax = OD + se),
                width = 0.3, position = position_dodge(0.9)) +
  scale_fill_manual(values = c("#FFFFFF", "#CCCCCC"), 
                    labels = c("Control", "Treatment X"),
                    name = NULL)+
  xlab("Time (days)") +
  ylab("Optical density after 20 days") +
  ylim(0, 1) +
  theme(panel.background = element_rect(fill = "white"),
        axis.line.x = element_line(color = "black"),
        axis.line.y = element_line(color = "black"))

staticpubfig-1


7. Animating!

Animating the figure over time requires the addition of just one line! transition_time(day):

ggplot(data = ralstoniasum, aes(x = strain, y = OD, fill = treatment )) +
  geom_bar(stat = "identity",colour = "black", position = position_dodge()) +
  geom_errorbar(aes(ymin = OD - se, ymax = OD + se),
                width = 0.3, position = position_dodge(0.9)) +
  transition_time(day)

animateddefaultfig-1

Or two lines if you want to show the days ticking through:

ggplot(data = ralstoniasum, aes(x = strain, y = OD, fill = treatment )) +
  geom_bar(stat = "identity",colour = "black", position = position_dodge()) +
  geom_errorbar(aes(ymin = OD - se, ymax = OD + se),
                width = 0.3, position = position_dodge(0.9)) +
  transition_time(day) + 
  labs(title = "Day: {frame_time}")

animateddefaultfig2-1

** Magic! **
Hope you enjoyed it and found it easy to follow.

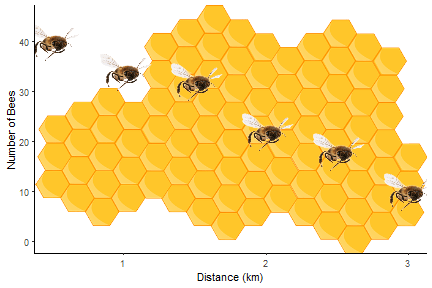
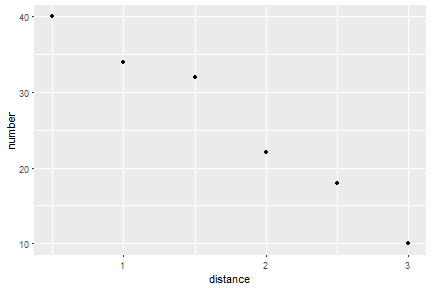
By combining the instructions above with those in Fun and easy R graphs with images and using this image, you should be able to work out how to get the figure at the top!

This design and the data are made-up but were inspired by the work of Microbiology PhD Student Sophie Clough in the Friman lab headed by Ville-Petri Friman.

Package references

R and all it’s packages are free so don’t forget to cite the awesome contributors.
How to cite packages in R

Hope, R.M. (2013). Rmisc: Rmisc: Ryan Miscellaneous. R package version 1.5. https://CRAN.R-project.org/package=Rmisc
Pedersen, T.L. and Robinson, D. (2017). gganimate: A Grammar of Animated Graphics. R package version 0.9.9.9999. http://github.com/thomasp85/gganimate
Wickham H. (2016). ggplot2: Elegant Graphics for Data Analysis. Springer-Verlag New York. ISBN 978-3-319-24277-4
Wickham, H., Hester, J. and Chang W. (2018). devtools: Tools to Make Developing R Packages Easier. R package version 1.13.6. https://CRAN.R-project.org/package=devtools

R Code Anatomy

It’s a challenge for an experienced user to remember what it was like to be totally new to R and come up with explanations that don’t draw on understanding developed subsequently. Terminology with which you have become very familiar is, in fact, jargon. So I asked a novice, Elliot, to explain a piece of code in his own words. Elliot is a 17 year old student half way through a BTEC Level 3 Extended Diploma in Science which is a qualification which provides access to Higher Education in the UK.

I have annotated with the jargon. In doing so I realised that the c() function is perhaps not the best example but that’s for another post.
R code Anatomy – a nice big image

RStudio Anatomy

RStudio makes R easier to use. It includes a code editor, debugging & visualization tools. I love it but when beginners launch RStudio they are sometimes confused by all the panes and tabs. Here I have tried to give a quick visual guide to the anatomy of RStudio for people new to R, coding and RStudio. I’d love to know if I’ve missed anything or I’ve if unintentionally used jargon!
RStudio Anatomy – a nice big image

It’s easy to cite and reference R!

Remember to reference R

When people are new to using R and, perhaps, to referencing and report writing in general, they often don’t know they should cite and reference R and its packages. We do this for the same reasons we reference any thing else in any academic work.

  1. We need to support our arguments with evidence and give readers the opportunity to evaluate the validity of that evidence. Citing R and its packages allows people to evaluate the reproducilibity of your analysis and results.
  2. We need to recognise and give credit for the work of others. R is a collaborative open source project with many contributors and citing R and its packages supports the development of such fantastic and free tools.

R makes it easy to do this!

The citation() function

This function outputs the reference for R

citation()
## 
## To cite R in publications use:
## 
##   R Core Team (2017). R: A language and environment for
##   statistical computing. R Foundation for Statistical Computing,
##   Vienna, Austria. URL https://www.R-project.org/.
## 
## A BibTeX entry for LaTeX users is
## 
##   @Manual{,
##     title = {R: A Language and Environment for Statistical Computing},
##     author = {{R Core Team}},
##     organization = {R Foundation for Statistical Computing},
##     address = {Vienna, Austria},
##     year = {2017},
##     url = {https://www.R-project.org/},
##   }
## 
## We have invested a lot of time and effort in creating R, please
## cite it when using it for data analysis. See also
## 'citation("pkgname")' for citing R packages.

BibTeX is just a format used by some reference managers.

You can get the citation information for R packages like this:

citation("ggplot2")
## 
## To cite ggplot2 in publications, please use:
## 
##   H. Wickham. ggplot2: Elegant Graphics for Data Analysis.
##   Springer-Verlag New York, 2009.
## 
## A BibTeX entry for LaTeX users is
## 
##   @Book{,
##     author = {Hadley Wickham},
##     title = {ggplot2: Elegant Graphics for Data Analysis},
##     publisher = {Springer-Verlag New York},
##     year = {2009},
##     isbn = {978-0-387-98140-6},
##     url = {http://ggplot2.org},
##   }

In your Methods section you might say something like:

Analysis was conducted in R (R Core Team, 2014) and figures were produced using the package ggplot2 (Wickham, 2009).

Usually, it will have more detail about the analysis itself. Here is an example:

We used R (R Core Team, 2017) with lme4 (Bates et al., 2015) to perform linear mixed (LME) analysis of cell function……….

Then in your reference list:

Bates, D., Maechler, M., Bolker, B. and Walker, S. (2015). Fitting Linear Mixed-Effects Models Using lme4.
Journal of Statistical Software, 67(1), 1-48. doi:10.18637/jss.v067.i01.

R Core Team (2014). R: A language and environment for statistical computing. R Foundation for Statistical
Computing, Vienna, Austria. URL http://www.R-project.org/

Wickham, H. (2009) ggplot2: elegant graphics for data analysis. Springer New York.

P.S. You do get this message every time you start R up!

R version 3.4.2 (2017-09-28) -- "Short Summer"
Copyright (C) 2017 The R Foundation for Statistical Computing
Platform: x86_64-w64-mingw32/x64 (64-bit)

R is free software and comes with ABSOLUTELY NO WARRANTY.
You are welcome to redistribute it under certain conditions.
Type 'license()' or 'licence()' for distribution details.

R is a collaborative project with many contributors.
Type 'contributors()' for more information and
'citation()' on how to cite R or R packages in publications.

Type 'demo()' for some demos, 'help()' for on-line help, or
'help.start()' for an HTML browser interface to help.
Type 'q()' to quit R.

Fun and easy R graphs with images

Code for fun

I feel passionately that anyone can learn some coding but many feel they lack natural aptitude for it.
One of the things I always try to stress to those I am teaching is that it matters very much less what you do than that do you it. It doesn’t matter how small and trivial the result of the code is, or even how much of it you wrote yourself. Any work you do with code at all, will build your confidence, experience and skills.

I recently wrote this post which included this R-generated plot:

a normal distribution with a common gull as a marker and sky as the background

Now I’m going to show you how to plot some data using one image as a marker and a different one for the back ground!

I will assume you have Rstudio installed and have at least a little experience with it but I’m aiming to make this do-able for beginners. I’ll also be using ggplot2 rather than base R.

1. Preparing

The first thing you want to do is make a folder on your computer in which the code you write and your images will live. Now you need some images.
I’m going to this as my background
some honeycomb

and this as my marker
a flying bee

You can use the same ones or use choose your own favourite images – try googling “public domain images”. You don’t want very high resolution images for the sake of speed but otherwise the size doesn’t matter.

The important thing is to save the images in to the folder you just created.

2. Getting started in RStudio

Start RStudio and set your working directory to the folder you created:
Setting your working directory

Now start a new script file:
starting a new script file

and save it as funplot.R or similar.

There are several packages you will need. If your images files are png like mine: ggplot2, png, grid, ggimage.
If your images files are jpeg: ggplot2, jpeg, grid, ggimage.

All these are already installed for biologists at the University of York. If you are on your own computer you will need to install them.

Click the install button and write the package names in the box to install them. I recommending doing them one at a time.
installing packages

Rstudio may need to install additional packages.

When everything is finished, you are ready to start coding!

3. Starting to code

Make the packages available for use in this Rstudio session by adding this code to your script and running it.

library(ggplot2)
library(png)
library(grid)
library(ggimage)

4. Making some data to plot

I am going to plot the number of bees arriving within one hour at food sources placed at different distances from the hive. The data are as follows:

Distance (km) No.bees
0.5 40
1.0 34
1.5 31
2.0 22
2.5 18
3 10

To put these data in to a dataframe in R add this code to your script

bees <- data.frame(distance = c(0.5, 1, 1.5, 2, 2.5, 3),
                  number = c(40, 34, 32, 22,18, 10))

Run that code. You do not need to re-run the first lines of code, just select the new lines and click run:
running some code

5. A boring graph of the data 😦

A simple default can be obtained with:

ggplot(data = bees, aes(x = distance, y = number)) +
  geom_point()

boringgraph-1
Edit that code to add information about the axis labels and axis limits

ggplot(data = bees, aes(x = distance, y = number)) +
  geom_point() +
  xlab("Distance (km)") +
  ylab("Number of Bees") +
  ylim(0, 45)

boringgraph2-1

6. A fun graph of the data! 🙂

We need to read in the background file:

img <- readPNG("comb.png")

Then we can edit the code with a annotation_custom() to add the background image:

ggplot(data = bees, aes(x = distance, y = number)) +
  annotation_custom(rasterGrob(img, 
                               width = unit(1,"npc"),
                               height = unit(1,"npc")), 
                    -Inf, Inf, -Inf, Inf) +
  geom_point() +
  xlab("Distance (km)") +
  ylab("Number of Bees") +
  ylim(0, 45)

fungraph1-1
Make sure you put the annotation_custom() before the geom_point() but don’t worry too much about what the other bits mean.

To use bees as markers we need to add the bee image file name to every row of the data frame:

bees$image <- "bee.png"

This adds a column called image to the dataframe called bees. We don’t have to explicitly read the image in because the ggimage package we loaded takes care of that. ggimage is an ‘extension’ to ggplot2.

Now edit your graph code again by removing the geom_point() and adding a geom_image() instead like this:

ggplot(data = bees, aes(x = distance, y = number)) +
  annotation_custom(rasterGrob(img, 
                               width = unit(1,"npc"),
                               height = unit(1,"npc")), 
                    -Inf, Inf, -Inf, Inf) +
  geom_image(aes(image = image), size = 0.15) +
  xlab("Distance (km)") +
  ylab("Number of Bees") +
  ylim(0, 45)

fungraph2-1

You can adjust the size of the marker by changing size = 0.15 and get rid of the gray background (and add axes) with:

ggplot(data = bees, aes(x = distance, y = number)) +
  annotation_custom(rasterGrob(img, 
                               width = unit(1,"npc"),
                               height = unit(1,"npc")), 
                    -Inf, Inf, -Inf, Inf) +
  geom_image(aes(image = image), size = 0.15) +
  xlab("Distance (km)") +
  ylab("Number of Bees") +
  ylim(0, 45) +
  theme(panel.background = element_rect(fill = "white"))+
  theme(axis.line.x = element_line(color = "black"),
        axis.line.y = element_line(color = "black"))

fungraph3-1

Ta da!! Hope you enjoyed it and it was easy to follow.

Not all common gulls are Common Gulls…

 … and non-normally distributed data can be normal

One of the underlying assumptions of many statistical methods is that the data (or the model residuals) are normally distributed. I teach students to evaluate this assumption with plots and normality tests. When they find their data do not seem to be normally distributed, they often report:

“… the data is abnormal”

This is incorrect, and not just because of the grammar. It arises when the name of the distribution confused is with the everyday-use of the word “normal”.

It’s true that the Normal distribution has acquired its name because seeing it is quite normal; many variables are normally distributed. Similarly, the Common gull (Lanus canus) is so-called because it is commonly seen. However, not all commonly seen gulls are Common gulls. Great black-backed gulls (Larus marinus) are not uncommon gulls.

There are several distributions which are common, usual and normal to see! For example, it is normal for counts to follow a Poisson distribution. Poisson data are definitely not Normal but they are not abnormal.

If your data are not normally distributed you might report:

“… the data are not normally distributed”

to be statistically and grammatically correct.

If it is not a Common gull it could be the common great black-backed gull or a herring gull.

Note: Yes, I do see ‘the data is’ much more frequently than the grammatically correct ‘the data are’

I’ll post how to do that plot in R soon…..